Description:
Here is an indicator, which draws daily, weekly and monthly pivots, support and resistance levels. All lines are drawn from the beginning of the timeframe (daily levels - from the beginning of the day etc.).
You will be able to choose which timeframe (monthly, weekly, daily) pivots, support and resistance levels to show. Also, there is an option to choose any level color. For more information visit ZoomInForex.com.
Update:
In v2 corrected issue on smaller timeframes, when labels did not show on chart. Now You can adjust label position by Yourself. Also, added customization possibility to change pivot, support and resistance lines type and width.
Download: ZMFX all pivot levels.mq4
Download: ZMFX all pivot levels v2.mq4
Description:
It alerts when Price Breaks Up or Down I-Regr lines.
Regression Channel
Linear Regression Channel consists of two parallel lines, equidistant up and down from the line of linear regression trend. The distance between frame of the channel and regression line equals to the value of maximum close price deviation from the regression line.
Linear Regression Channel
Second-power (Parabolic) Polynomial Regression Channel
Third-power Polynomial Regression Channel
MetaTrader Indicator i-Regr Setting
Degree - power of Polynomial : 1- linear; 2- parabolic; 3- Third-power
MetaTrader Expert Advisor e-Regr based on Regression Channel MetaTrader Indicator
If price lower than under line - Buy
If price bigger than upper line - Sell
TakeProfit by average line.
Stop Loss = 0 but you can set Stop Loss
Trend Protection: If D1 candle (for previously day) bigger than 150 pips – trade prohibition and close all opened position.
Stop Loss = 0 but you can set Stop Loss
Trend Protection: If D1 candle (for previously day) bigger than 150 pips – trade prohibition and close all opened position.
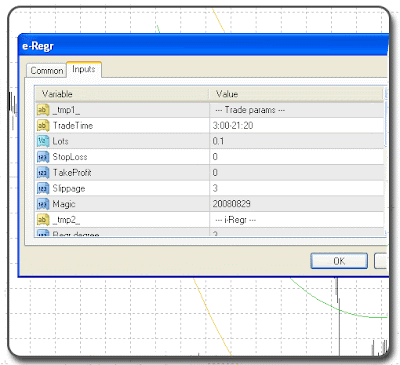
MetaTrader Expert Advisor e-Reg Setting
Warning: The Expert advisor e-Regr was not adjusted and was not optimized.
Download: i-Regr.mq4
Download: e-Regr.mq4
Description:
Kaufman Volatility according to Perry Kaufman books "Smarter Trading".
Download: b_Kaufman_Volatility.mq4
Description:
Kaufman Efficiency Ratio (also called "generalized fractal efficiency") according to Perry Kaufman books "Smarter Trading" and "Trading Systems & Methods".
Download: b_Kaufman_Efficiency_Ratio.mq4
Description:
This indicator compares four types of regression (linear, quadratic, logarithmic and exponential) and chooses the one that best fits the data analyzed.
This analysis is done every time there is a new tick.
// ---- inputs
// dp_limiter  It should be >2 . If not it will be autoset to default value
// endpos      Last value position to the right. It should be >0. If not it
//             will be autoset to default value
// record      [true] - record on; [false] - record off
extern int       dp_limiter   =100;        // Number of data points
extern int       endpos       =0;          // Last value position
extern double    multStdDev   =1.96;       // Bands separation
extern bool      record       =false;      // Record info into a file text
In the left top corner of the chart four values are displayed. These values represent the dispersion of data regarding to its regression, so the smallest value indicates the best option. Additionally, the indicator allows recording these values into a text file for further analysis.
Download: b_Regression_Analysis.mq4
Description:
More information at my blog. Allows You to have a look at 8 currency pairs and their 5 indicators with this, 1 indicator. It is recommended to use it on higher time frames, such as 4H, Daily, Weekly. For example, if trading on 15MIN TF, put this on Daily chart, and trade strongest and weakest currency pairs, depending on trend direction.
Arrow descriptions:
LIME arrow - extreme Bullish trend.
GREEN arrow - simple Bullish trend.
FIREBRICK arrow - simple Bearish trend.
LIME arrow - extreme Bullish trend.
GREEN arrow - simple Bullish trend.
FIREBRICK arrow - simple Bearish trend.
RED arrow - extreme Bearish trend.
Download: ZMFX Forex Trend v3.mq4
I do not take and will not take any glory for it cus i am not worthy for it.
It is that I found it too good to be ignored and I can see that many do not even know of its efficacy.
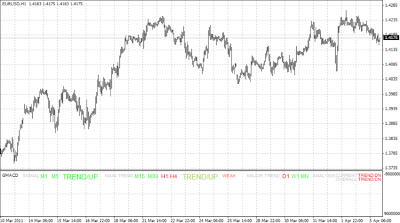
Download: GMACD_Signals.mq4
Simply displays active hours (definied by the user).
Useful for visual backtesting.
Download: JJN-ActiveHours.mq4
Automatic Andrews, Schiff or modified Schiff pitchforks.
IMHO: modified Schiff is the best.
Download: JJN-AutoPitchforx.mq4
Intra-[Month,Week,Day,H4,H1 ...] Fibonacci. (Maybe) one of the most useful Fibonacci tool.
For example:
Intraweek (BasisTF=10080) Fibonacci on H1 chart with ProcessedUnits=1:
Intraweek (BasisTF=10080) Fibonacci on H1 chart with ProcessedUnits=2:
Download: JJN-Fibo.mq4
Indicator that shows profits and losses (in pips and money).
I use PosX and PosY, because I like it better than Corner.
I use PosX and PosY, because I like it better than Corner.
Download: JJN-TradeInfo.mq4
It calculates number of bars on charts and then based on histogram it draws a arrow which is again confirmed when next opening bar price its high in case of buy arrow or low in case of sell signal, when both these conditions are satisfied it draws an arrow.
it is price behavior change It means if arrow has appeared price will change it direction a five bars sequence, where the central bar has higher maximum or lower minimum arrow shows central bar position.
Sound pop-up alert as well email alert have been added to it.
Recommended timeframe 1 hr.
it is price behavior change It means if arrow has appeared price will change it direction a five bars sequence, where the central bar has higher maximum or lower minimum arrow shows central bar position.
Sound pop-up alert as well email alert have been added to it.
Recommended timeframe 1 hr.
Download: trendsignal.mq4
Description:
This indicator compares four types of regression (linear, quadratic, logarithmic and exponential) and chooses the one that best fits the data analyzed.This version:
- Fixed an error in calculating the standard deviation;
- Makes more use of the indicators of MQL4 standard library;
- Improved the functions of calculation of the regressions;
- Frees a buffer. It only uses 3 buffers now;
- Added a Comment parameter to enable/disable comments on the screen.
Download: b_Regression_Analysis_v2.mq4
Description:
This indicator forecast the future movement of highest and lowest prices depending on similar movement in the past by weighted mean. It calculates squares of difference between current bars and past bars to decide the similarity.
External variables:- BasePeriod --- Number of basement bars to forecast
- ForecastPeriod --- Bars to forecast
- Samples --- Period to check similarity to current movement
- BaseElements --- Number of elements to choose for forecasting
Download: RDI_ForexForecast.mq4
Description:
It is the bbsqueeze indicator but with OsMA as momentum.If you want the original bbsqueeze indicator, you can find it here on Code Base.
Be aware of the changes I have made on the setups for the Keltner Channels.
It´s just for filtering out to many setups.
Download: BbSq-OsMA.mq4
You can choose Stochastic for only 1 current TimeFrame (TimeFrame2 = false; TimeFrame3 = false; TimeFrame4 = false)
or up to 4 TimeFrames (TimeFrame2 = true; TimeFrame3 = true; TimeFrame4 = true).
The indicator is automatically calculates the following 3 TF.Download: Stoc-2B.mq4
Description:
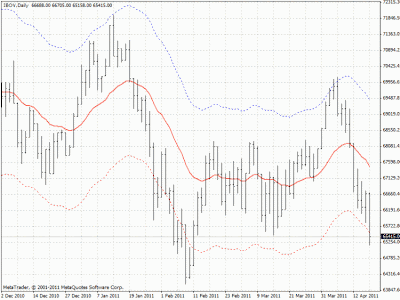
Another version for AutoEnvelope according to the format described by Dr. Alexander Elder in your book How To Take Profits, Cut Losses, and Benefit from Price Declines.
Download: my-envelope.mq4


